


 18 / 82

A D V A N C E D M A T E R I A L S & P R O C E S S E S | F E B R U A R Y / M A R C H 2 0 1 7
1 8
Synthetic microstructures were
generated for a rolled and annealed
high-purity tantalum material from
Cabot Corp. The plate composition was
high purity, with ppm contents of <50 O,
10 N, 10 C, and 5 H. EBSD analysis was
performed with a step size of 1.0 µm
on a Phillips XL30 FEG SEM, using the
TSL data collection and analysis soft-
ware, encompassing tens of thousands
of grains, capturing more than 100,000
boundary segments. Grain size, orien-
tation distribution function (ODF), and
grain boundary misorientation param-
eters were determined using the TSL
orientation imaging microscopy (OIM)
software. Based on statistics collect-
ed on the tantalum material including
grain size and morphology, and ODF, a
statistics file was generated and used
within DREAM.3D to generate digital
microstructure volumes. An example
of digitally generated tantalum materi-
al is shown in Fig. 2. A large number of
such volumes were created and it was
confirmed that the statistics are similar
to the starting material from which the
experimental data was collected.
The method provides an unlimited
supply of digital microstructures, which
are statistically representative of the
original material. Synthetic volumes are
surface meshed to enable moving mod-
els into FEM or other simulations. Inter-
pretation of physical behavior is per-
formed by comparing experimental to
calculated free surface velocity respons-
es by including hypothesized mech-
anisms within the theoretical model
used to conduct the simulations.
INVESTIGATING DUCTILE
DAMAGE
As mentioned previously, nucle-
ation of damage is a statistical pro-
cess where 3D distribution of sizes and
strengths of defects, local heteroge-
neous polycrystal stress states, and
poorly understood atomistic level phys-
ical mechanisms of damage nucleation
play a fundamental role. Figure 3 shows
void damage in a tantalum sample
tested in a plate impact gas gun exper-
iment; microstructure characterization
indicates that voids nucleate at specific
microstructural features.
Serial sectioning and volumetric
reconstruction of void-based damage
in the sample enables quantification of
the true size, shape, and distribution of
both individual microstructural features
and their local neighborhoods. This
reveals hidden connectivity between
features (Fig. 4), insight unobtainable
from 2D-based stereological approach-
es. The 3D reconstruction also indicates
that the amount of void damage varies
fromsection to section between 3%and
15%. Void fraction variation is assumed
to depend on the spatial distribution of
damage prone microstructural features
in the material.
Optical microscopy reveals materi-
al damage such as voids and cracks or
retained microstructural features, but
it fails to indicate how the rest of the
material is affected by the deformation
processes. EBSD data can be processed
to extract orientation image maps and
plots enabling visual representation
of orientation related aspects of the
deformed microstructure. Local mis-
orientation can be characterized using
a kernel misorientation approach. Ker-
nel average misorientation (KAM) maps
are now a standard method to indicate
relative differences in crystallographic
orientation between neighboring points
in a sample. KAMs was applied to quali-
tatively evaluate localized plastic strain
in the material. Generally, KAM is high-
er in deformed regions or grains. For
the specimen presented here, KAM was
calculated to the 5th neighbor, with
a maximum misorientation of 6˚. Re-
gions with less than 2˚misorientation
were considered undeformed. The 3D
reconstruction of KAM maps obtained
from EBSD (Fig. 5) in shocked tantalum
reveals contiguous and complex plastic
linkages in 3D. Therefore, the micro-
structure not only must be viewed as a
3D concept, but the events and features
related to deformation and damage
also must develop in 3D.
Fig. 3 —
Void damage in a tantalum
sample tested in a plate impact gas gun
experiment.
Fig. 2 —
Comparison of statistics from a digitally generated tantalummicrostructure containing
1500 grains to the real material.
Fig. 4 —
3D reconstruction of void distribu-
tion in shocked tantalum.
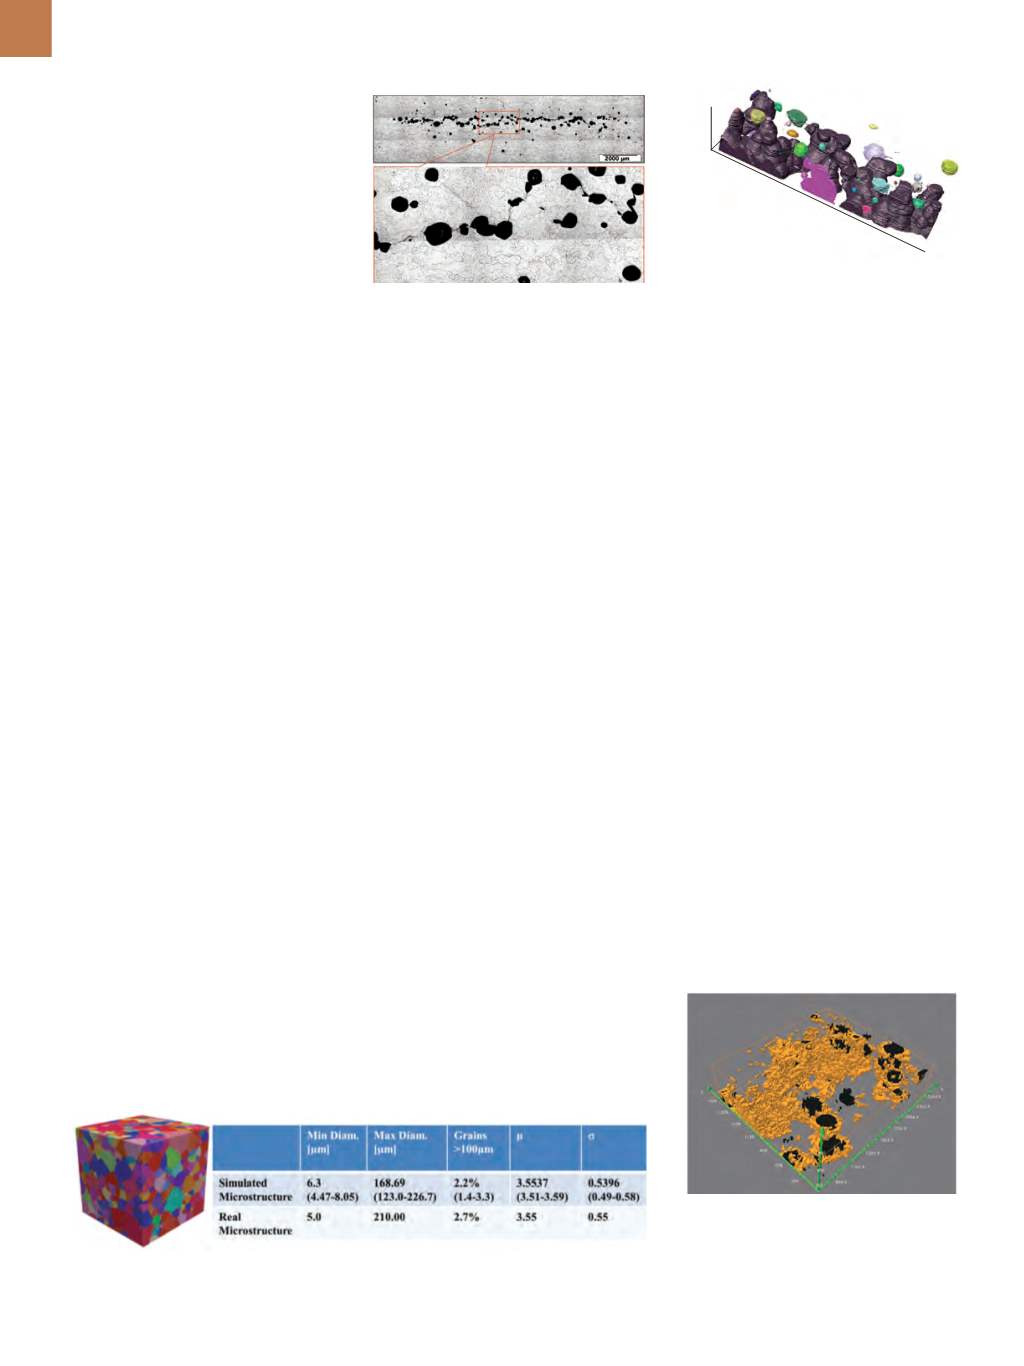
Fig. 5 —
3D reconstruction of kernel aver-
age misorientation (KAM) maps in shocked
tantalum. Black and orange represent void
damage and deformation affected material,
respectively.
Cavitation, linkage by localized shear, and void coalescence
500
1000
1500
2000
x [μm]
400
300
200
100
Z [μm]
200
Y