


 22 / 82

A D V A N C E D M A T E R I A L S & P R O C E S S E S | F E B R U A R Y / M A R C H 2 0 1 7
2 2
tint etched using Klemm’s I reagent at
a magnification of 100× (the magnifi-
cation bar was removed to make grain
area analysis simpler). Figure 2 shows
detection of grain boundaries by IA.
Boundaries can be eroded to one pix-
el width, with the image then inverted
to detect grain interiors. Each grain is
measured for its area, and the areas
are mathematically analyzed for skew
and kurtosis. Grain areas are ordered
from largest to smallest, and grain ar-
eas in each grain size class (as defined
in Table 1) are added and divided by the
total area of all grains measured and ex-
pressed as a percentage (Table 2). A plot
of these data (Fig. 3) has a kurtosis of
2.55 (close to a perfect normal Gaussian
distribution), and the data cover eight
ASTM G classes with an average grain
size of ASTM G = 6.66. Due to the nature
of the G calculation (Eq. 1), the distribu-
tion of % grain areas per G class versus
G reveals a normal distribution. By com-
parison, the x axis in Fig. 4a is a linear
scale of grain areas rather than G values,
and the distribution is now log-normal.
By using seven grain area classes rather
than 14 (Fig. 4b), the distribution curve
is smoother with less noise.
Example 2.
Figure 5a shows the
grain structure of E-Brite 26-1,* a ferrit-
ic stainless steel, etched electrolytically
using aqueous 60% nitric acid at 1 V dc
for 20 s. The structure exhibits areas of
banding with coarse and finer grains.
Figure 5b shows the detected grain ar-
eas measured by IA. Table 3 contains
measurement data by ASTM G class
covering 14 G classes. The skew is 3.59,
while the kurtosis is 18.62, well above
Fig. 1
—
Ferrite grain structure of a motor
lamination steel etched using Klemm’s I
reagent at a magnification of 100×
(magnification bar removed for grain area
measurements).
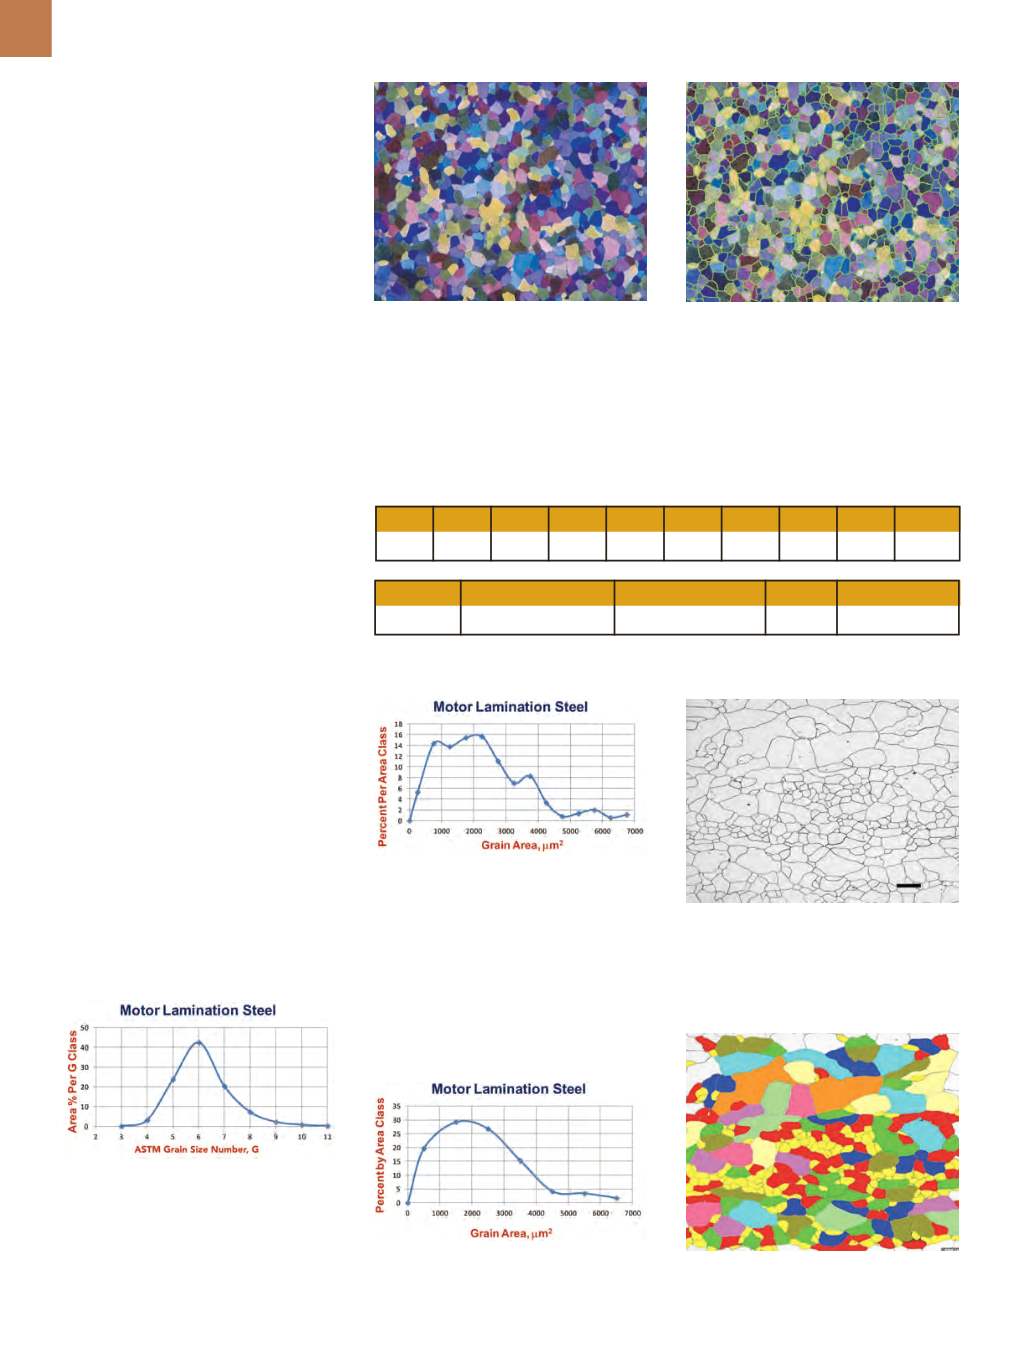
Fig. 3
—
Grain size distribution curve for
motor lamination steel revealing excellent
unimodal, Gaussian grain size distribution
with a mean ASTM grain size of 6.63, kurtosis
of 2.55, skew of 1.43, and a distribution
covering eight grain size classes.
Fig. 4a
—
Plotting grain areas (covering 14
grain size classes) for the motor lamination
steel instead of ASTM grain size (G) on the x
axis reveals a log-normal grain area distri-
bution rather than the unimodal Gaussian
distribution show in Fig. 3.
Fig. 4b
—
Seven grain classes plotted on a
linear scale using grain area rather than G.
Fig. 2
—
Detection of grain boundaries by
image analysis.
Fig. 5a
—
Example of non-Gaussian grain
size distribution containing regions of
coarse and fine ferrite grains.
Fig. 5b
—
Detection of grain interiors by
image analysis.
TABLE 2—BINNINGOF GRAINAREAS BYGCLASS FORMOTOR LAMINATIONSTEEL
G 3
4
5
6
7
8
9
10
11
% Area 0
3.19 23.76 42.53 20.25 7.21 2.19 0.76 0.12
No. grains ∑ grain areas, μm
2
Avg. grain area, μm
2
ASTM G No. of G classes
891
1,158,903
1300.68
6.63
8