


 65 / 82

A D V A N C E D
M A T E R I A L S
&
P R O C E S S E S | F E B R U A R Y / M A R C H
2 0 1 7
6 5
FEATURE
15
face within the computational domain. Each computa-
tional face is thus treated as a separate heat transfer zone
with the HTCs based on local conditions. Temperature-de-
pendent properties were used for both Inconel 718 and
Houghton 3420.
Temperature data were recorded during the simula-
tion process at each thermocouple location to compare
against experimentally measured values. The degree of
correlation at each location was based on the average
difference between the simulated and measured tem-
peratures over 1500 seconds of simulated time. This is
essentially the integrated area between the simulated and
measured cooling curves divided by total simulation time.
For the still oil case, average temperature deviations
ranged from 14.9° to 28.5°C, indicating that the simulation
provides a good representation of the actual quenching
behavior. For the thermocouples on the rimof the part, the
average spread of temperature data was 27.3°C, while the
average deviation between simulated temperature and
the mean of the six rim thermocouples was just 22.2°C. In
other words, the correlation of the simulation was within
the variation band for the actual process.
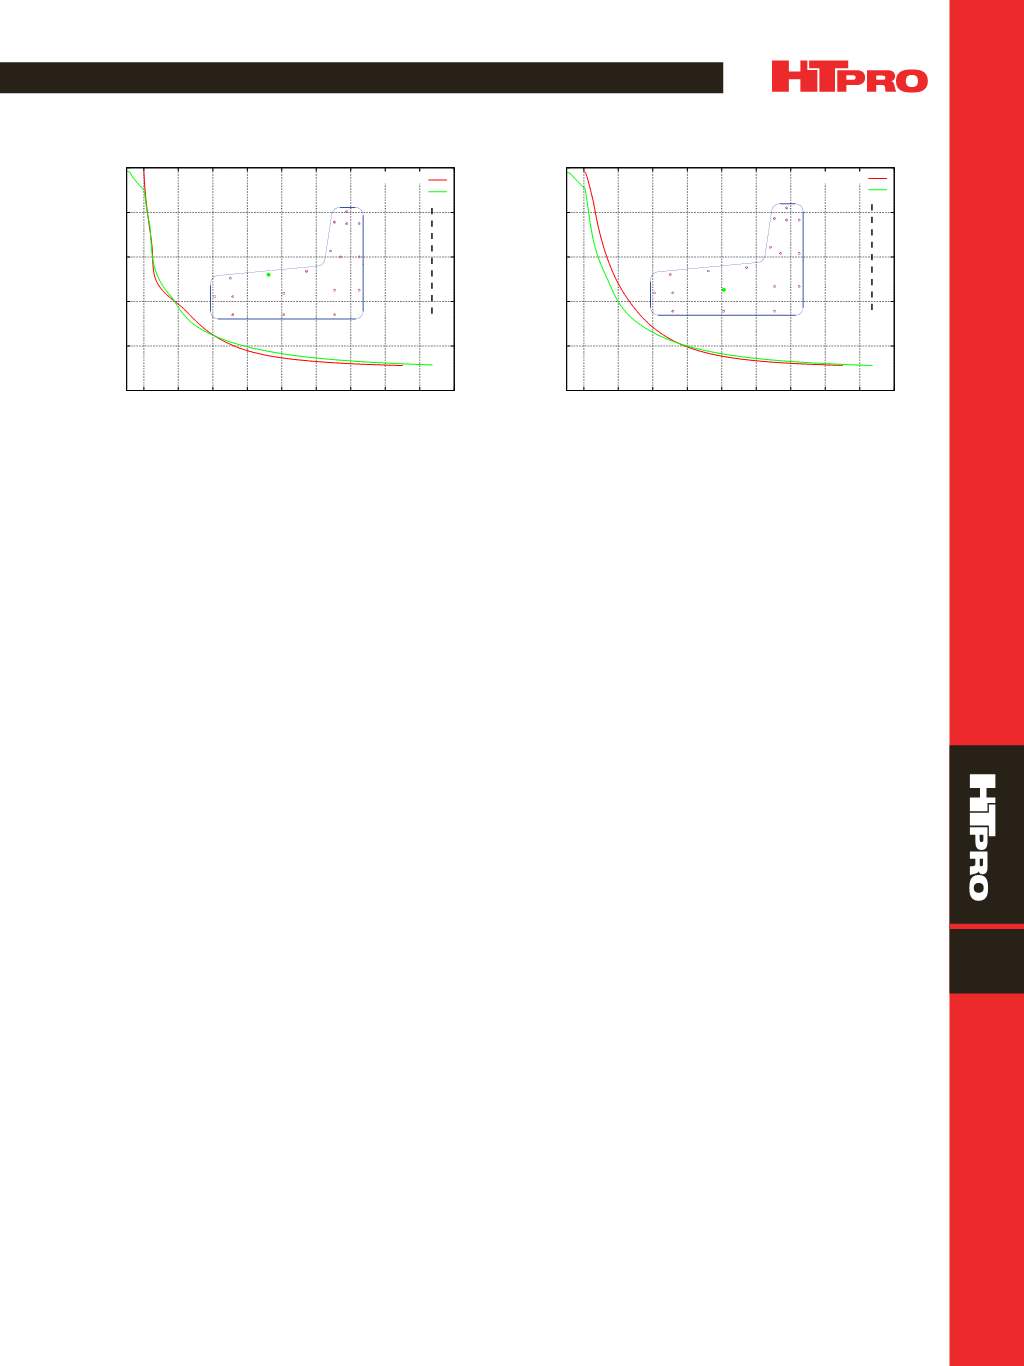
Cooling curves for locations with the least and great-
est average deviations are shown in Figs. 3 and 4. The
curves in Fig. 3 are in close agreement over the entire cool-
ing range. The agreement in Fig. 4 is not as good, but it still
predicts overall cooling behavior fairly well. The location
of the greatest deviation in a buried thermocouple is curi-
ous, and may suggest a difference between simulated and
actual thermal properties of Inconel 718.
CONCLUSION
A method has been developed combining carefully
collected flow boiling heat flux data with CFD simulations
to provide accurate simulations of quenching operations.
A comparison of simulated and experimentally measured
cooling rates for a non-trivial geometry has shown good
correlation, indicating that this tool provides a practical
method of assessing and improving industrial quenching
operations. The level of correlation shown in the example
indicates that the experimental database is not limited to
the original test conditions (as with typical quench trials),
but rather has broad applicability.
~HTPro
Acknowledgments
This material is based on work supported by the United
States Air Force under Contract No. FA8650-12-C-5110. Any
opinions, findings, and conclusions or recommendations
expressed in this material are those of the author(s) and
do not necessarily reflect the views of the United States Air
Force. Airflow Sciences would also like to thank members of
the Air Force Research Laboratories Nickel Residual Stress
FEP program (United States Air Force Contract No. FA8650-
13-2-5201) for their collaboration on work related to the ge-
neric turbine disk shape.
Reference
1.
Edward B. Coy, Measurement of Transient Heat Flux
and Surface Temperature Using Embedded Temperature
Sensors,
Journal of Thermophysics and Heat Transfer,
Vol 24, No. 1, 2010.
For more information:
Andrew L. Banka is technical direc-
tor of Airflow Sciences Corp., 12190 Hubbard St., Livonia,
MI, 48150, 734.525.0300,
abanka@airflowsciences.com,
www.airflowsciences.com.
Centerline (not to scale)
0
200
400
600
800
1000
0 200 400 600 800 1000 1200 1400 1600 1800
Temperature (C)
Time (s)
Simulation
Experimental Data
Fig. 4 —
Location with poorest correlation for still oil generic
turbine disk.
0
200
400
600
800
1000
0 200 400 600 800 1000 1200 1400 1600 1800
Temperature (C)
Time (s)
Simulation
Experimental Data
Centerline (not to scale)
Fig. 3 —
Location with best correlation for still oil generic turbine
disk.