


 40 / 82

iTSSe
TSS
A D V A N C E D M A T E R I A L S & P R O C E S S E S | F E B R U A R Y / M A R C H 2 0 1 7
4 0
8
iTSSe
TSS
COLD SPRAY: ADVANCED CHARACTERIZATION
METHODS—SCANNING ELECTRON MICROSCOPY
This article series explores the indispensable role of characterization in the
development of cold spray coatings and illustrates some of the common
processes used during coatings development.
Dheepa Srinivasan, GE Power, GE India Technology Center, Bangalore
S
canning electron microscopes are often used to view
features that exceed the resolution of optical micro-
scopes. Images can be magnified up to 100,000 times
and typically require only minimal sample preparation.
Several key aspects of scanning electron microscopy (SEM)
distinguish it from other analytical techniques, including the
equipment’s depth of field and the ability to obtain chem-
ical composition information using energy-dispersive x-ray
spectroscopy (EDS) or wavelength-dispersive spectroscopy
(WDS).
The microscope has a lateral resolution of 1 to 50 nm in
the secondary electron mode. EDS provides rapid multi-ele-
ment analysis for Z > 11, with a detection limit of ~200 ppm.
WDS is based on the phenomenon of Bragg diffraction of
x-rays incident on a crystal and yields a more precise quan-
titative estimate of elements. SEM is uniquely able to image
in both secondary electron (SE) mode and backscattered
electron (BE) mode. Figure 1 shows a comparison of EDS and
WDS spectra from a complex multi-element glass.
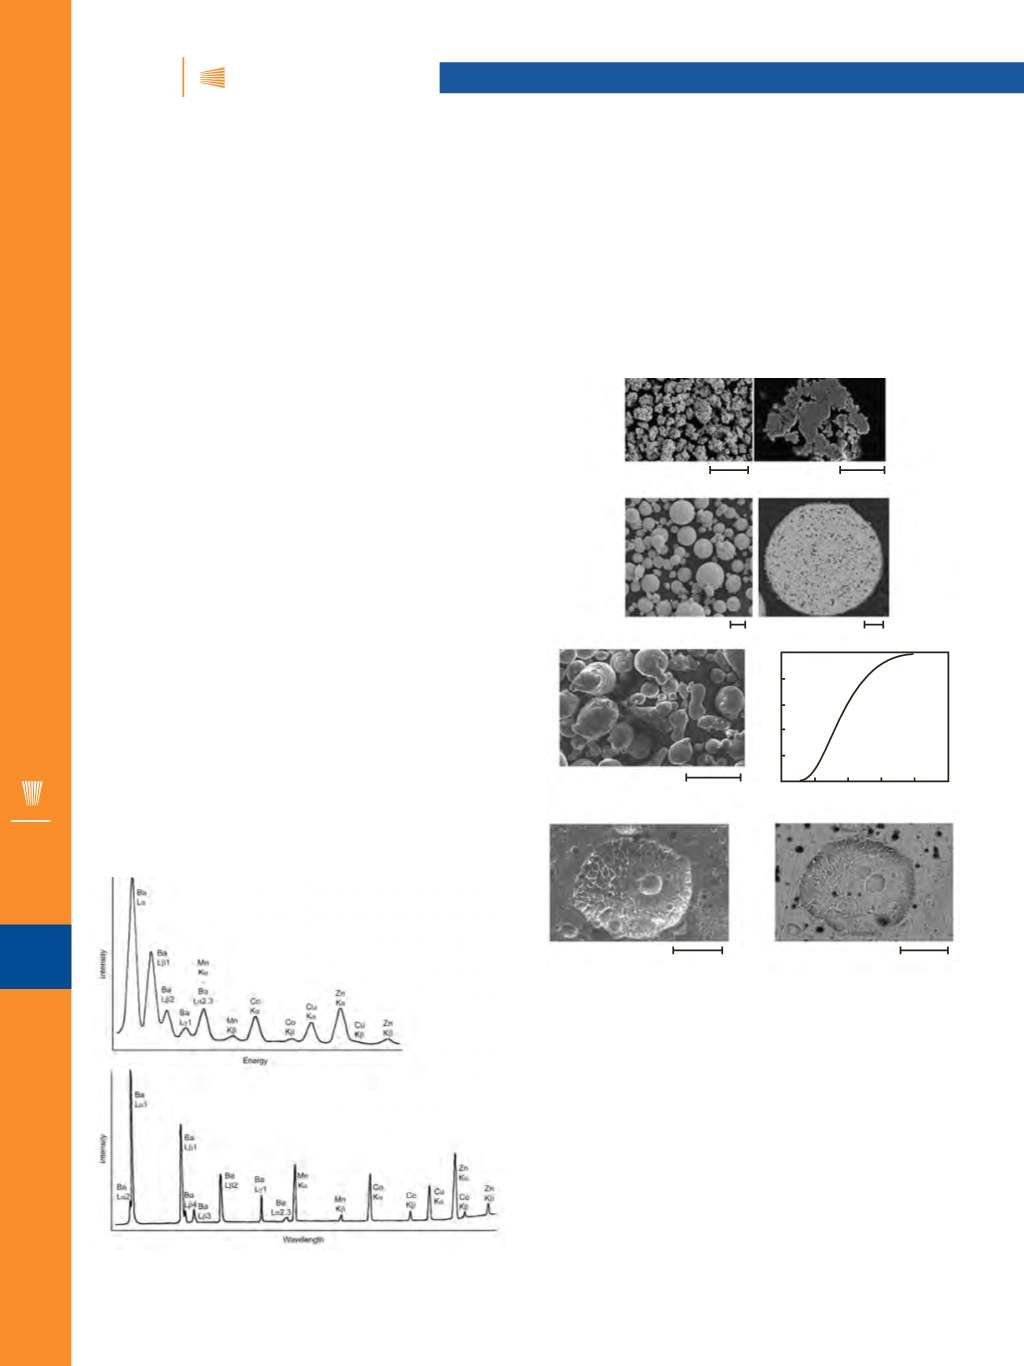
In cold spray characterization, SEM analyzes feedstock
powders for particle size, distribution, shape, and chemical
composition prior to spraying. Figures 2 (a) and (b) show rep-
resentative scanning electron micrographs with two types of
WC-Co feedstock powders used for cold spray, with an acicu-
lar and a spherical shape. SEM is used prior to spray to assess
powder cross-section (Fig. 2 c, d) and particle size distribution
(Fig. 2 e, f).
Imaging can be done in either the SE or BE mode, as
shown in Fig. 2 (g) and (h), respectively, taken from an alumi-
num coating. SE imaging typically reveals topography, while
Fig. 1 —
Comparison of EDS and WDS spectra from a complex
multi-element glass.
Fig. 2 —
SEMs show powder morphology and cross-sectional
structure from: (a, b) two different feedstocks of WC-Co powders,
(c, d) powder cross-section, (e) morphology and (f) size distribution
of aluminum feedstock powder, and (g, h) secondary electron
image and backscattered image of an aluminum coating.
(a)
(c)
(b)
(d)
100μm
10μm
10μm
20μm
(e)
(g)
(h)
(f)
50μm
20μm
20μm
1
0.8
0.6
0.4
0.2
0
0 20 40 60 80 100
Cumulative volume fraction
Particle size/μm
FEATURE ARTICLE