


 38 / 82

iTSSe
TSS
A D V A N C E D M A T E R I A L S & P R O C E S S E S | F E B R U A R Y / M A R C H 2 0 1 7
3 8
6
iTSSe
TSS
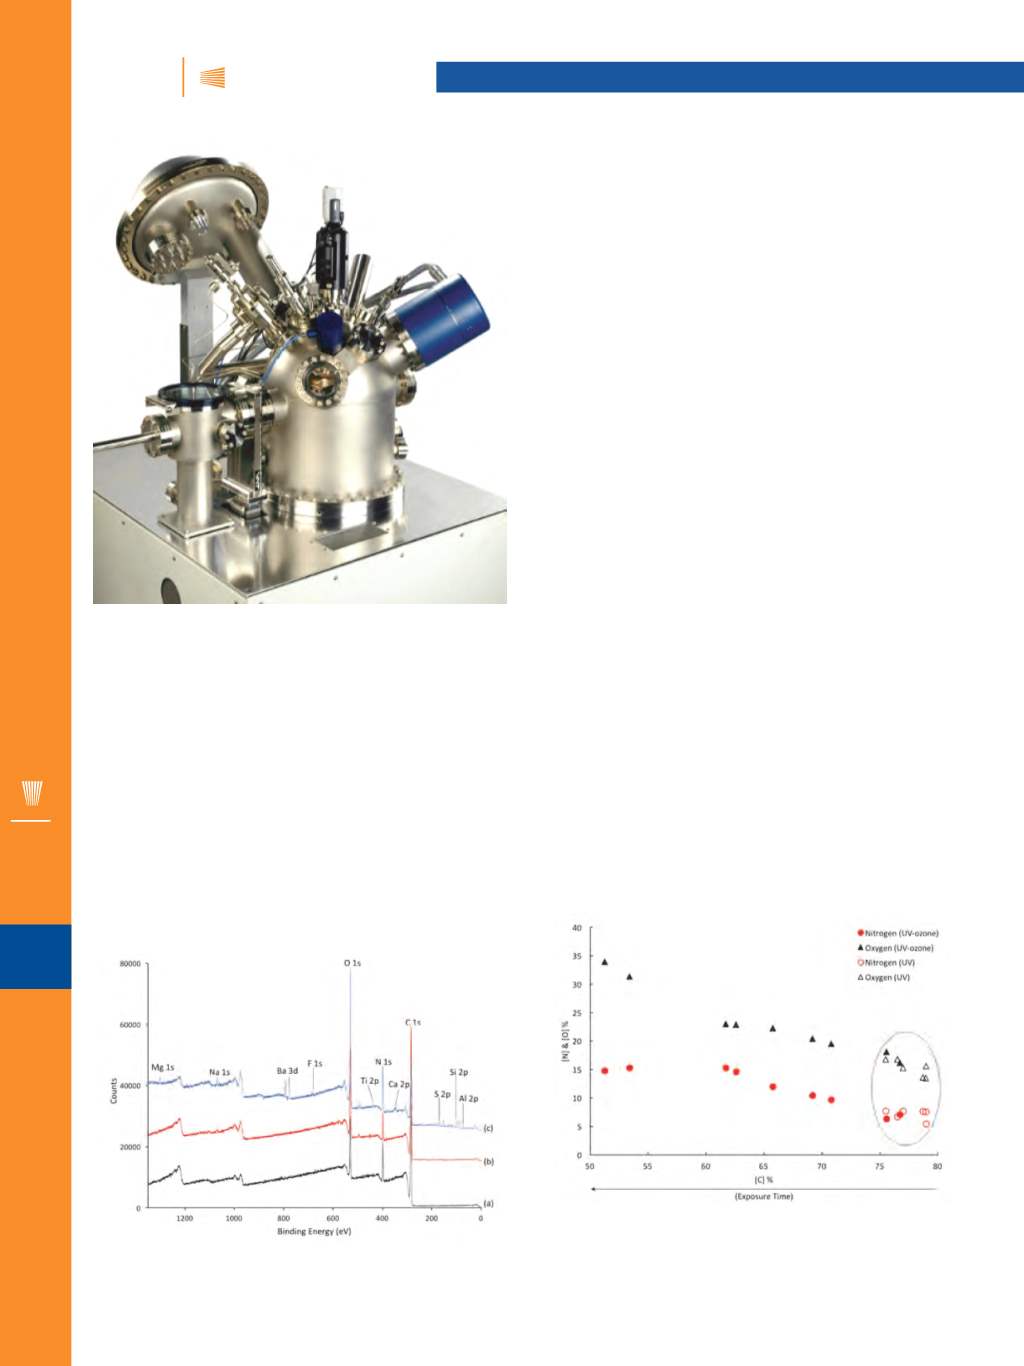
The XPS survey spectrum details all the elements
present at their respective binding energies (BE). From Fig.
3a, it is apparent that with no exposure, carbon, oxygen,
and nitrogen are dominant, which is to be expected from a
polyurethane (PU) base topcoat. After 56 days of exposure
to UV, very little change is evident (Fig. 3b). However, after
120 minutes of UV/ozone exposure, the survey spectrum
(Fig. 3c) shows a significant rise in inorganic components.
These are representative of the filler and pigmentation
present within the coating. Observing such a significant in-
crease of inorganic components at the surface suggests the
PU has degraded to reveal the bulk inorganic components.
However, by comparing the organic components, changes
Fig. 2 —
XPS Theta Probe.
Fig. 3 —
XPS survey spectra of (a) unexposed topcoat, (b) UV ex-
posed for 56 days, and (c) UV/ozone exposed for 120 minutes..
Fig. 4 —
Relative concentrations of oxygen (triangular) and
nitrogen (circular) against the relative concentration of carbon for
UV exposed samples and UV/ozone exposed samples. Increasing
exposure time is suggested from right to left along the x axis.
occurring to the PU can be understood and the two testing
methods can be compared, overriding the differing time
scales.
Figure 4 shows that with increasing UV/ozone exposure,
relative amounts of nitrogen and oxygen generally increase
with decreasing carbon. However, with UV exposure from 2
to 56 days there is no clear trend, with data points cluster-
ing around the 1-2 minute marks of UV/ozone. This suggests
that 56 days within the QUV chamber equates to 1-2 minutes
of the HyperTest method. Additionally, the high-resolution
spectrum of the carbon 1s peak exhibits a rise in the carbon-
yl component at BE 288.2 eV and a drop in the aliphatic car-
bon at BE 285.0 eV suggesting the oxidation of the topcoat
with UV/ozone exposure (Fig. 5a). In contrast, after 56 days
of UV exposure, the C 1s spectrum (Fig. 5b) resembles that
of an unexposed topcoat (Fig. 5c). The additional detail that
can be provided by ToF-SIMS, although complex, is vital in
aiding a more detailed mechanistic understanding. By ex-
amining the organic peaks of the spectra and putting them
through principle component analysis (PCA), it was possible
to ascertain dominant peaks that increased with increasing
UV/ozone exposure, thus enabling identification of the azo
compound, a product of degradation.
Unifying all of the detailed analysis enables a com-
prehensive understanding of chemical changes occurring
to the coating upon UV/ozone exposure. It is proposed that
UV radiation is able to penetrate the coating and break the
weakest bond of the PU backbone through chain scission.
This creates free radicals that further decompose, forming
amino radicals that react to form the azo product, while ad-
ditionally forming simple volatile molecules such as CO
2
.
The presence of ozone accelerates this process by providing
a greater flux of oxygen to oxidize the surface, thereby creat-
ing an etching effect.
FEATURE ARTICLE